Using geostationary satellite data,explore how solar radiation changes
Use real AMATERASS Japan-area data at 1 km resolution and 10-minute intervals to explore satellite data analysis with Linux and Java.
FIELD: HIMAWARI msm.1km / 1 km / 10 min
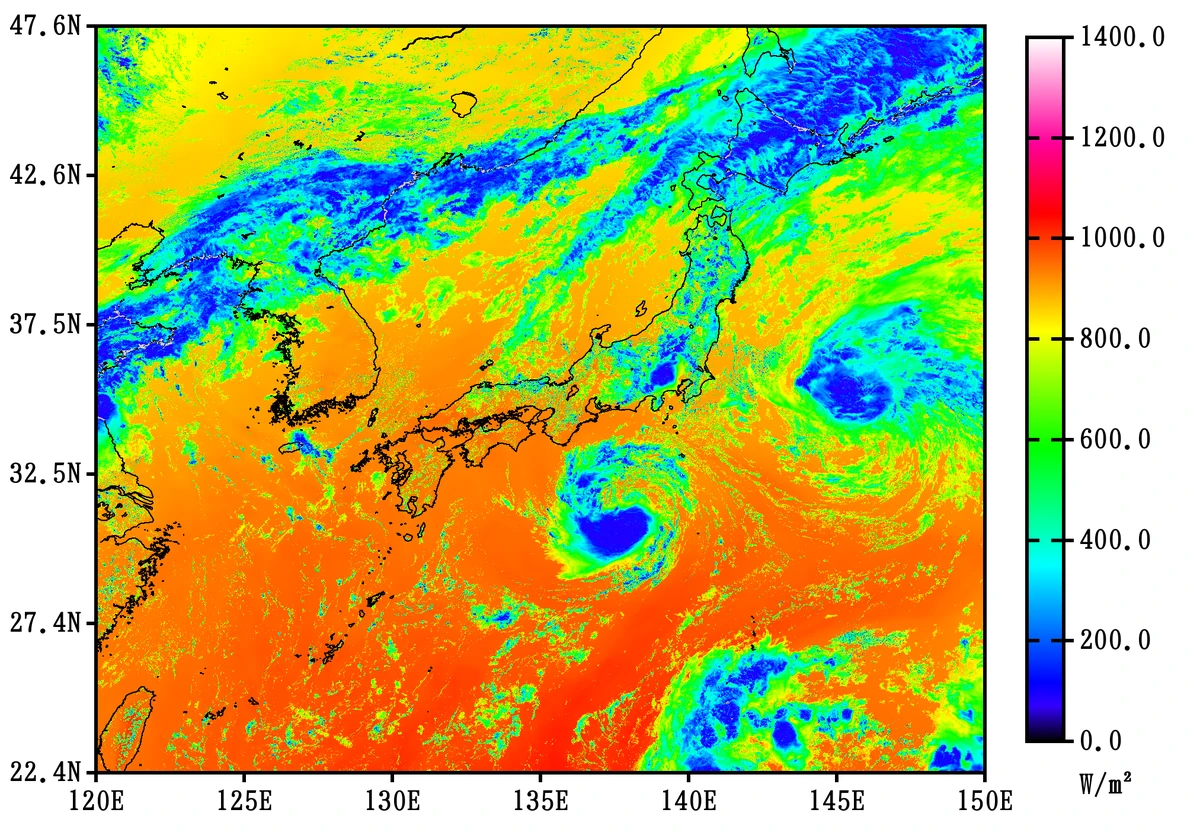
Example of AMATERASS Japan-area 1 km data (20 Aug 2016, 03:00 UTC)
Today's research question
How does solar radiation change with time and location? Using real AMATERASS data, you will move step by step through observation, processing, comparison, and interpretation. Start with LEVEL 0 to check your Ubuntu environment, then continue through seven missions.
1
Check the mission
First, make sure you know what you are going to investigate.
2
Run the analysis
Use the provided scripts and programs to process real data.
3
Check the result
At the end of each step, check the result and understand what happened before moving on.
Build the analysis one level at a time
LEVEL 1Track changes over time
LEVEL 2Compare days
LEVEL 3Zoom in on a region
LEVEL 4Look at one month
LEVEL 5Difference from monthly mean
LEVEL 6Point time series
LEVEL 7Compare PV output
LEVEL 0 / SYSTEM CHECK
MISSION 0: Prepare your analysis environment
MISSION GOALFirst, check that Java, GNU Wget 1.x, bzip2, GNU date, ImageMagick, and Gnuplot are available on Ubuntu.
Working directory: Do all work in ~/amaterass_lab. Move to that directory first, then use wget to download each required file directly into it.
0
Check the required commands
Before starting the analysis, check that all required commands are available.
1. Download the required files in the working directory
mkdir -p ~/amaterass_lab
cd ~/amaterass_lab
wget -O system_check.sh https://amaterass.science/science-lab/system_check.sh
Check this layout before running the command
~/amaterass_lab/
└── system_check.sh
2. Run
cd ~/amaterass_lab
chmod +x system_check.sh
./system_check.sh
java OK javac OK GNU Wget 1.x OK bzip2 OK GNU date OK ImageMagick OK Gnuplot OK SYSTEM READY
If you see NG: That item is not ready yet. Install or configure the required software and make sure every item shows OK before continuing.
✓
LEVEL 0 CLEAR When SYSTEM READY appears, continue to LEVEL 1.
Go one level deeper: what is running underneath?
If something does not work
If you see SYSTEM NOT READY, first identify the line marked NG. The check_cmd function tests each required command independently, so the missing tool is explicit.
./system_check.sh
Read the programs used in this LEVEL
These are the actual sources downloaded and executed by this page. You do not need to understand every line; start by tracing the inputs, the physical-data processing, and the outputs.
STEP 1Find required commands
STEP 2Evaluate OK / NG
STEP 3SYSTEM READY
system_check.sh Shell
What does it do? Checks Java, GNU Wget 1.x, bzip2, GNU date, ImageMagick, and Gnuplot, and prints SYSTEM READY only when every required command is available.
MISSION 1: How does solar radiation change every 10 minutes?
MISSION GOALRead the AMATERASS Japan-area 1 km data yourself, then expand from a single map to a GIF animation over consecutive times. Before that, confirm that the data value, latitude, longitude, and actual observation time all correspond to the same pixel.
STEP 1Prepare Tmap
STEP 2Four data files
STEP 3Read one pixel
STEP 4–6Make the frames
STEP 7Build the GIF
Read each AMATERASS pixel as value + location + time
Japan-area msm.1km is a 2521-row × 3001-column grid. At the same [row, column] index, solar radiation, latitude, longitude, and time describe the same observed pixel.
.tar.gz.java.class.sh.txt.bin / .bz2 / .b.png.gif
1
Prepare Tmap
To map solar radiation, prepare Tmap ver.3.0 C² and the helper script draw_map.sh.
tmap_v3.0cc_ 20260815d.tar.gzTmap
→
📁
tmap/Java program
+
sh
draw_map.shScience Lab helper
draw_map.sh passes the grid settings needed for this Science Lab to Tmap.
1. Download the required files in the working directory
cd ~/amaterass_lab
wget -c https://downloads.amaterass.science/tmap_v3.0cc_20260815d.tar.gz
wget -O draw_map.sh https://amaterass.science/science-lab/draw_map.sh
CHECK After decompression, each of the four files should be 30,262,084 bytes. Check with ls -l data/reference/*.bin data/sample/*.bin.
3
Read value, location, and time for the same pixel
Prepare the Science Lab analysis programs, find the pixel nearest a chosen location from LAT/LNG, and read solar radiation and actual observation time from the same array index.
What TIME means: The 03:00 in the filename is the nominal time. Because the satellite scans the Earth, the actual observation time differs slightly from pixel to pixel. The TIME file stores elapsed time from 00:00 UTC on that date, in units of days.
1. Download the required files in the working directory
cd ~/amaterass_lab
wget -O analysis_msm1km.tar.gz https://amaterass.science/science-lab/analysis_msm1km.tar.gz
cd ~/amaterass_lab
./draw_map.sh data/sample/201608200300.dwn.sw.flx.sfc.msm.1km.bin 1400 0 7 "W/m²"
✓
CHECK Open data/sample/201608200300.dwn.sw.flx.sfc.msm.1km.bin.png and observe the spatial pattern.
5
Expand to consecutive times
To follow daytime in Japan, download solar-radiation data every 10 minutes from 23:00 UTC on August 19 (08:00 JST on August 20) through 10:40 UTC on August 20 (19:40 JST). Times with no data are skipped automatically.
23:0023:1023:20…10:2010:3010:40
The available times will be used in chronological order.
1. Download the required files in your work directory
cd ~/amaterass_lab
wget -O download_animation_data.sh https://amaterass.science/science-lab/download_animation_data.sh
LEVEL 1 CLEAR Open amaterass_20160820.gif and observe the changes over time.
OBSERVATION: Observe how solar radiation changes over time and how the pattern differs from place to place.
Go one level deeper: what is running underneath?
If something does not work
If the first timestamp is incomplete, inspect the sample/reference directories and rerun the same download. Complete files are reused and incomplete binaries are replaced.
ls -lh data/sample/
ls -lh data/reference/
./download_one.sh 2016 08 20 03 00
You can also rerun download_animation_data.sh if too few animation frames were obtained.
Read the programs used in this LEVEL
These are the actual sources downloaded and executed by this page. You do not need to understand every line; start by tracing the inputs, the physical-data processing, and the outputs.
STEP 1Download data
STEP 2Match LAT/LNG/TIME
STEP 3Map & animate with Tmap
download_reference.sh Shell
What does it do? Downloads the fixed LAT/LNG grids shared by all timestamps and validates the decompressed file sizes.
What does it do? Downloads solar radiation and TIME for one timestamp. An incomplete .bin is not trusted: it is removed unless its size is exactly 30,262,084 bytes.
#!/bin/shset-eu
select_wget(){ifcommand-vwget1>/dev/null2>&1;thenechowget1
elifcommand-vwget>/dev/null2>&1&&!wget--version2>&1|grep-q'Wget2';thenechowget
elseecho'Error: GNU Wget 1.x (wget or wget1) is required.'>&2exit1fi}["$#"-eq5]||{echo"Usage: $0 YYYY MM DD HH MN">&2;exit1;}YYYY=$1;MM=$2;DD=$3;HH=$4;MN=$5case"$YYYY"in[0-9][0-9][0-9][0-9]);;*)echo'YYYY must be four digits.'>&2;exit1;;esaccase"$MM"in0[1-9]|1[0-2]);;*)echo'MM must be 01-12.'>&2;exit1;;esaccase"$DD"in0[1-9]|[12][0-9]|3[01]);;*)echo'DD must be 01-31.'>&2;exit1;;esaccase"$HH"in[01][0-9]|2[0-3]);;*)echo'HH must be 00-23.'>&2;exit1;;esaccase"$MN"in00|10|20|30|40|50);;*)echo'MN must be one of 00,10,20,30,40,50.'>&2;exit1;;esacDAY="${YYYY}${MM}${DD}";TIME="${DAY}${HH}${MN}";YYYYMM="${YYYY}${MM}"EXPECTED=30262084WGET=$(select_wget)BASE=${AMATERASS_JP_BASE:-ftp://amaterass.cr.chiba-u.ac.jp/quasi-realtime/himawari829/archived/JP}DEST=data/sample;DIR="$BASE/$YYYYMM/$DAY";mkdir-p"$DEST"
file_is_complete(){FILE=$1;[-f"$FILE"]||return1;SIZE=$(wc-c<"$FILE"|tr-d' ');["$SIZE"-eq"$EXPECTED"];}DECOMP_PID=;DECOMP_NAME=;DECOMP_BZ2=
cleanup_pending(){[-n"$DECOMP_PID"]||return0;kill"$DECOMP_PID"2>/dev/null||true;wait"$DECOMP_PID"2>/dev/null||true;rm-f"$DEST/$DECOMP_NAME""$DEST/$DECOMP_BZ2";DECOMP_PID=;DECOMP_NAME=;DECOMP_BZ2=;}trap'cleanup_pending'0trap'cleanup_pending; exit 1'1215
finish_decompress(){[-n"$DECOMP_PID"]||return0if!wait"$DECOMP_PID";thenrm-f"$DEST/$DECOMP_NAME""$DEST/$DECOMP_BZ2";echo"Decompression failed: $DECOMP_BZ2">&2;DECOMP_PID=;return1;fiif!file_is_complete"$DEST/$DECOMP_NAME";thenSIZE=$(wc-c<"$DEST/$DECOMP_NAME"2>/dev/null|tr-d' '||echo0);rm-f"$DEST/$DECOMP_NAME""$DEST/$DECOMP_BZ2";echo"Unexpected file size: $DEST/$DECOMP_NAME ($SIZE bytes)">&2;DECOMP_PID=;return1;firm-f"$DEST/$DECOMP_BZ2";DECOMP_PID=;DECOMP_NAME=;DECOMP_BZ2=}forTYPEindwn.sw.flx.sfc.msm.1km.bingrd.time.mjd.hms.msm.1km.bin
doNAME="$TIME.$TYPE";BZ2="$NAME.bz2"iffile_is_complete"$DEST/$NAME";thenrm-f"$DEST/$BZ2";echo"Already exists: $DEST/$NAME";continue;fiif[-e"$DEST/$NAME"];thenSIZE=$(wc-c<"$DEST/$NAME"|tr-d' ');echo"Removing incomplete file: $NAME ($SIZE bytes)";rm-f"$DEST/$NAME";fi(cd"$DEST"&&"$WGET"-c"$DIR/$BZ2")finish_decompress||exit1rm-f"$DEST/$NAME"(cd"$DEST"&&bzip2-d"$BZ2")&DECOMP_PID=$!;DECOMP_NAME=$NAME;DECOMP_BZ2=$BZ2done
finish_decompress||exit1trap-01215echo"Sample solar/TIME ready: $TIME"
draw_map.sh Shell
What does it do? A thin wrapper that passes the binary field and grid information to Tmap. It keeps numerical processing separate from visualization.
#!/bin/shset-eu
["$#"-eq5]||{echo"Usage: $0 file max min color_div unit">&2;exit1;}FILE=$1MAX=$2MIN=$3DIV=$4UNIT=$5[-f"$FILE"]||{echo"Missing: $FILE">&2;exit1;}[-ftmap/tmap.class]||{echo'Tmap is not compiled. Run: cd tmap && javac *.java'>&2;exit1;}GRID="$FILE.grid.txt"if[-f"$GRID"];thengetv(){sed-n"s/^$1=//p""$GRID"|head-n1;}WIDTH=$(getvwidth)HEIGHT=$(getvheight)NORTH=$(getvnorth)LAT_SPAN=$(getvlat_span)WEST=$(getvwest)LON_SPAN=$(getvlon_span)LAT_DIV=$(getvlat_div)LON_DIV=$(getvlon_div):"${LAT_DIV:=6}""${LON_DIV:=6}"elseSIZE=$(wc-c<"$FILE"|tr-d' ')if["$SIZE"-ne30262084];thenecho"No grid metadata for non-standard file: $FILE">&2exit1fiWIDTH=3001HEIGHT=2521NORTH=47.6
LAT_SPAN=25.2
LAT_DIV=5WEST=120LON_SPAN=30LON_DIV=6fi(cdtmap
javatmap"../$FILE""$MAX""$MIN""$DIV""$UNIT"autopng\"$NORTH""$LAT_SPAN""$LAT_DIV""$WEST""$LON_SPAN""$LON_DIV"\"$WIDTH""$HEIGHT")
download_animation_data.sh Shell
What does it do? Converts the requested JST interval to UTC and downloads 10-minute fields. Network transfer remains single-stream while bzip2 decompression runs with up to four jobs by default.
#!/bin/shset-eu
select_wget(){ifcommand-vwget1>/dev/null2>&1;thenechowget1;elifcommand-vwget>/dev/null2>&1&&!wget--version2>&1|grep-q'Wget2';thenechowget;elseecho'Error: GNU Wget 1.x (wget or wget1) is required.'>&2;exit1;fi;}["$#"-eq7]||["$#"-eq8]||{echo"Usage: $0 YYYY MM DD START_HH START_MN END_HH END_MN [DECOMP_JOBS]">&2;exit1;}YYYY=$1;MM=$2;DD=$3;START_HH=$4;START_MN=$5;END_HH=$6;END_MN=$7;JOBS=${8:-4};DAY="${YYYY}${MM}${DD}"case"$JOBS"in''|*[!0-9]*)echo'DECOMP_JOBS must be a positive integer.'>&2;exit1;;esacCHECK=$(date-u-d"${YYYY}-${MM}-${DD}"+%Y%m%d2>/dev/null||true);["$CHECK"="$DAY"]||{echo'Invalid calendar date.'>&2;exit1;}START=$(date-u-d"${YYYY}-${MM}-${DD}${START_HH}:${START_MN} +0900"+%s);END=$(date-u-d"${YYYY}-${MM}-${DD}${END_HH}:${END_MN} +0900"+%s);["$END"-ge"$START"]||{echo'End time must not be earlier than start time.'>&2;exit1;}EXPECTED=30262084;WGET=$(select_wget);BASE=${AMATERASS_JP_BASE:-ftp://amaterass.cr.chiba-u.ac.jp/quasi-realtime/himawari829/archived/JP};DEST="data/animation/$DAY";LIST="$DEST/timestamps.txt";mkdir-p"$DEST";:>"$LIST"
file_is_complete(){FILE=$1;[-f"$FILE"]||return1;SIZE=$(wc-c<"$FILE"|tr-d' ');["$SIZE"-eq"$EXPECTED"];}QUEUE=;RUNNING=0
cleanup_queue(){forJOBin$QUEUE;doPID=${JOB%%|*};REST=${JOB#*|};NAME=${REST%%|*};BZ2=${REST#*|};kill"$PID"2>/dev/null||true;wait"$PID"2>/dev/null||true;rm-f"$DEST/$NAME""$DEST/$BZ2";done;QUEUE=;RUNNING=0;}trap'cleanup_queue'0;trap'cleanup_queue; exit 1'1215
finish_oldest(){["$RUNNING"-gt0]||return0;set--$QUEUE;JOB=$1;shift;QUEUE="$*";PID=${JOB%%|*};REST=${JOB#*|};NAME=${REST%%|*};BZ2=${REST#*|};if!wait"$PID";thenrm-f"$DEST/$NAME""$DEST/$BZ2";echo"Decompression failed: $BZ2">&2;exit1;fi;if!file_is_complete"$DEST/$NAME";thenSIZE=$(wc-c<"$DEST/$NAME"2>/dev/null|tr-d' '||echo0);rm-f"$DEST/$NAME""$DEST/$BZ2";echo"Unexpected file size: $DEST/$NAME ($SIZE bytes)">&2;exit1;fi;rm-f"$DEST/$BZ2";echo"Ready: $NAME";RUNNING=$((RUNNING-1));}
start_decompress(){NAME=$1;BZ2=$2;rm-f"$DEST/$NAME";(cd"$DEST"&&bzip2-d"$BZ2")&PID=$!;QUEUE="${QUEUE}${QUEUE:+ }${PID}|${NAME}|${BZ2}";RUNNING=$((RUNNING+1));["$RUNNING"-lt"$JOBS"]||finish_oldest;}T=$START;TOTAL=0while["$T"-le"$END"];doTIME=$(date-u-d"@$T"+%Y%m%d%H%M);printf'%s\n'"$TIME">>"$LIST";TOTAL=$((TOTAL+1));YYYYMM=$(printf'%s'"$TIME"|cut-c1-6);YYYYMMDD=$(printf'%s'"$TIME"|cut-c1-8);NAME="$TIME.dwn.sw.flx.sfc.msm.1km.bin";BZ2="$NAME.bz2"iffile_is_complete"$DEST/$NAME";thenrm-f"$DEST/$BZ2";elseif[-e"$DEST/$NAME"];thenSIZE=$(wc-c<"$DEST/$NAME"|tr-d' ');echo"Removing incomplete file: $NAME ($SIZE bytes)";rm-f"$DEST/$NAME";fi;URL="$BASE/$YYYYMM/$YYYYMMDD/$BZ2";if(cd"$DEST"&&"$WGET"-q-c"$URL");thenstart_decompress"$NAME""$BZ2";elserm-f"$DEST/$BZ2";fi;fiT=$((T+600))donewhile["$RUNNING"-gt0];dofinish_oldest;donetrap-01215READY=$(whileIFS=read-rTIME;dofile_is_complete"$DEST/$TIME.dwn.sw.flx.sfc.msm.1km.bin"&&echo1;done<"$LIST"|wc-l|tr-d' ')["$READY"-gt1]||{echo'Not enough frames were downloaded.'>&2;exit1;}echo"Available frames: $READY / $TOTAL (max $JOBS decompression jobs)";echo"Timestamp list: $LIST"
render_animation.sh Shell
What does it do? Uses Tmap to render each downloaded field as a PNG frame.
#!/bin/shset-eu
["$#"-eq7]||{echo"Usage: $0 YYYY MM DD MAX MIN COLOR_DIV UNIT">&2;exit1;}YYYY=$1;MM=$2;DD=$3;MAX=$4;MIN=$5;DIV=$6;UNIT=$7DAY="${YYYY}${MM}${DD}"DEST="data/animation/$DAY"LIST="$DEST/timestamps.txt"[-f"$LIST"]||{echo"Missing: $LIST">&2;exit1;}COUNT=0whileIFS=read-rTIME;do[-n"$TIME"]||continueFILE="$DEST/$TIME.dwn.sw.flx.sfc.msm.1km.bin"[-f"$FILE"]||continue./draw_map.sh"$FILE""$MAX""$MIN""$DIV""$UNIT"COUNT=$((COUNT+1))done<"$LIST"["$COUNT"-gt1]||{echo'Not enough frames to render.'>&2;exit1;}echo"PNG frames ready: $COUNT"
make_animation.sh Shell
What does it do? Uses ImageMagick to combine the rendered PNG frames into one GIF animation.
#!/bin/shset-eu
["$#"-eq5]||{echo"Usage: $0 YYYY MM DD WIDTH DELAY">&2;exit1;}YYYY=$1;MM=$2;DD=$3;WIDTH=$4;DELAY=$5DAY="${YYYY}${MM}${DD}"DEST="data/animation/$DAY"LIST="$DEST/timestamps.txt"OUT="amaterass_${DAY}.gif"[-f"$LIST"]||{echo"Missing: $LIST">&2;exit1;}case"$WIDTH"in''|*[!0-9]*)echo'WIDTH must be a positive integer.'>&2;exit1;;esaccase"$DELAY"in''|*[!0-9]*)echo'DELAY must be a non-negative integer.'>&2;exit1;;esac["$WIDTH"-gt0]||{echo'WIDTH must be greater than zero.'>&2;exit1;}set--
whileIFS=read-rTIME;do[-n"$TIME"]||continuePNG="$DEST/$TIME.dwn.sw.flx.sfc.msm.1km.bin.png"[-f"$PNG"]||continueset--"$@""$PNG"done<"$LIST"["$#"-gt1]||{echo'Not enough PNG files for an animation.'>&2;exit1;}ifcommand-vmagick>/dev/null2>&1;thenmagick-delay"$DELAY"-loop0"$@"-resize"${WIDTH}x""$OUT"elifcommand-vconvert>/dev/null2>&1;thenconvert-delay"$DELAY"-loop0"$@"-resize"${WIDTH}x""$OUT"elseecho'ImageMagick is required.'>&2exit1fiecho"Created: $OUT ($# frames, ${WIDTH} px wide)"
FloatGrid.java Java
What does it do? Shared Java helper for reading and writing headerless Big-endian Float32 grids consistently across the analysis programs.
importjava.io.*;importjava.nio.*;importjava.nio.channels.*;importjava.nio.file.*;importjava.util.*;finalclassFloatGrid{staticlongfloatCount(Pathp)throwsIOException{longsize=Files.size(p);if((size&3L)!=0)thrownewIOException("File size is not a multiple of 4: "+p);returnsize/4L;}staticvoidrequireSameSize(Path...ps)throwsIOException{longs=Files.size(ps[0]);for(Pathp:ps)if(Files.size(p)!=s)thrownewIOException("Grid size mismatch: "+p);}staticMappedByteBuffermap(Pathp)throwsIOException{try(FileChannelch=FileChannel.open(p,StandardOpenOption.READ)){MappedByteBufferb=ch.map(FileChannel.MapMode.READ_ONLY,0,ch.size());b.order(ByteOrder.BIG_ENDIAN);returnb;}}staticfloatreadAt(Pathp,longindex)throwsIOException{try(RandomAccessFileraf=newRandomAccessFile(p.toFile(),"r")){raf.seek(index*4L);returnraf.readFloat();}}staticvoidwriteFloats(Pathout,float[]data)throwsIOException{Files.createDirectories(out.toAbsolutePath().getParent());try(DataOutputStreamdos=newDataOutputStream(newBufferedOutputStream(Files.newOutputStream(out)))){for(floatv:data)dos.writeFloat(v);}}staticPathgridMetaPath(Pathbin){returnPaths.get(bin.toString()+".grid.txt");}staticbooleanhasGridMeta(Pathbin){returnFiles.isRegularFile(gridMetaPath(bin));}staticPropertiesreadGridMeta(Pathbin)throwsIOException{Pathp=gridMetaPath(bin);Propertiesprops=newProperties();try(Readerr=Files.newBufferedReader(p)){props.load(r);}returnprops;}staticvoidcopyGridMeta(PathfromBin,PathtoBin)throwsIOException{Pathfrom=gridMetaPath(fromBin);Pathto=gridMetaPath(toBin);if(Files.isRegularFile(from)){Files.copy(from,to,StandardCopyOption.REPLACE_EXISTING);}else{Files.deleteIfExists(to);}}staticbooleansameGridMeta(Patha,Pathb)throwsIOException{booleanah=hasGridMeta(a);booleanbh=hasGridMeta(b);if(!ah&&!bh)returntrue;if(ah!=bh)returnfalse;returnreadGridMeta(a).equals(readGridMeta(b));}}
pixelinfo.java Java
What does it do? Finds the grid pixel nearest the requested latitude/longitude, reads solar radiation and TIME at the same index, and reconstructs the actual UTC observation time for that pixel.
importjava.nio.*;importjava.nio.file.*;importjava.time.*;importjava.time.format.*;publicclasspixelinfo{publicstaticvoidmain(String[]args)throwsException{if(args.length!=6){System.err.println("Usage: pixelinfo solar lat lng time target_lat target_lon");System.exit(1);}Pathsolar=Paths.get(args[0]),latf=Paths.get(args[1]),lngf=Paths.get(args[2]),timef=Paths.get(args[3]);doubletargetLat=Double.parseDouble(args[4]);doubletargetLon=Double.parseDouble(args[5]);FloatGrid.requireSameSize(solar,latf,lngf,timef);longn=FloatGrid.floatCount(solar);if(n>Integer.MAX_VALUE)thrownewIllegalArgumentException("Grid too large");MappedByteBufferlat=FloatGrid.map(latf);MappedByteBufferlng=FloatGrid.map(lngf);doublebest=Double.POSITIVE_INFINITY;intbestIndex=-1;floatbestLat=Float.NaN,bestLon=Float.NaN;for(inti=0;i<(int)n;i++){floatla=lat.getFloat(i*4);floatlo=lng.getFloat(i*4);if(!Float.isFinite(la)||!Float.isFinite(lo))continue;doubledlat=la-targetLat;doubledlon=(lo-targetLon)*Math.cos(Math.toRadians(targetLat));doubled2=dlat*dlat+dlon*dlon;if(d2<best){best=d2;bestIndex=i;bestLat=la;bestLon=lo;}}if(bestIndex<0)thrownewIllegalStateException("No valid coordinate found");floatflux=FloatGrid.readAt(solar,bestIndex);floatdays=FloatGrid.readAt(timef,bestIndex);Stringname=solar.getFileName().toString();if(name.length()<8)thrownewIllegalArgumentException("Filename must begin with YYYYMMDD");LocalDatedate=LocalDate.parse(name.substring(0,8),DateTimeFormatter.BASIC_ISO_DATE);longmillis=Math.round(days*86400.0*1000.0);Instantinstant=date.atStartOfDay(ZoneOffset.UTC).toInstant().plusMillis(millis);DateTimeFormatterfmt=DateTimeFormatter.ofPattern("yyyy-MM-dd HH:mm:ss.SSS 'UTC'").withZone(ZoneOffset.UTC);intnx=3001;introw=bestIndex/nx;intcol=bestIndex%nx;System.out.printf("pixel : row=%d column=%d (0-based)%n",row,col);System.out.printf("latitude : %.6f deg%n",bestLat);System.out.printf("longitude : %.6f deg%n",bestLon);System.out.printf("solar flux : %.3f W/m^2%n",flux);System.out.printf("actual UTC : %s%n",fmt.format(instant));}}
LEVEL 2 / DAILY MEAN
MISSION 2: How different is solar radiation from day to day?
MISSION GOALCreate daily-mean solar-radiation fields for August 19, 20, and 21, 2016 (UTC) from 10-minute data, then map all three with the same color scale. For each UTC hour with solar-radiation files, average the available 10-minute values. Hours with no solar-radiation files at night are treated as 0 W/m², and the daily mean is calculated over all 24 hours.
STEP 1Analysis tools
STEP 2Prepare three days
STEP 3Compute daily means
STEP 4Map all three
GOALCompare the days
1
Check the analysis tools from LEVEL 1
Confirm that the programs needed for daily averaging are ready.
CHECK Continue when data/daily_raw/20160819/, 20160820/, and 20160821/ have been created.
3
Create a daily mean for each of the three days
For each UTC hour with data, average the available 10-minute values. Nighttime hours with no solar-radiation files are treated as 0 W/m², and the daily mean is calculated over all 24 hours.
Before you calculate: Which of August 19, 20, or 21 do you expect to show the largest areas of high solar radiation?
1. Download the required file in your work directory
cd ~/amaterass_lab
wget -O make_daily_mean.sh https://amaterass.science/science-lab/make_daily_mean.sh
These are the actual sources downloaded and executed by this page. You do not need to understand every line; start by tracing the inputs, the physical-data processing, and the outputs.
STEP 1Download one day
STEP 2Hourly means
STEP 324-hour daily mean
download_day.sh Shell
What does it do? Checks the 144 nominal 10-minute slots in a day and downloads available solar-radiation files. Wget stays single-stream; decompression uses up to four jobs and incomplete binaries are removed automatically.
#!/bin/shset-eu
select_wget(){ifcommand-vwget1>/dev/null2>&1;thenechowget1
elifcommand-vwget>/dev/null2>&1&&!wget--version2>&1|grep-q'Wget2';thenechowget
elseecho'Error: GNU Wget 1.x (wget or wget1) is required.'>&2;exit1fi}["$#"-eq3]||["$#"-eq4]||{echo"Usage: $0 YYYY MM DD [DECOMP_JOBS]">&2;exit1;}YYYY=$1;MM=$2;DD=$3;JOBS=${4:-4}case"$JOBS"in''|*[!0-9]*)echo'DECOMP_JOBS must be a positive integer.'>&2;exit1;;esac["$JOBS"-ge1]||{echo'DECOMP_JOBS must be at least 1.'>&2;exit1;}DAY="${YYYY}${MM}${DD}";YYYYMM="${YYYY}${MM}";EXPECTED=30262084WGET=$(select_wget);BASE=${AMATERASS_JP_BASE:-ftp://amaterass.cr.chiba-u.ac.jp/quasi-realtime/himawari829/archived/JP};DEST="data/daily_raw/$DAY"
mkdir-p"$DEST"
file_is_complete(){FILE=$1;[-f"$FILE"]||return1;SIZE=$(wc-c<"$FILE"|tr-d' ');["$SIZE"-eq"$EXPECTED"];}QUEUE=;RUNNING=0
cleanup_queue(){forJOBin$QUEUE;doPID=${JOB%%|*};REST=${JOB#*|};NAME=${REST%%|*};BZ2=${REST#*|};kill"$PID"2>/dev/null||true;wait"$PID"2>/dev/null||true;rm-f"$DEST/$NAME""$DEST/$BZ2";done;QUEUE=;RUNNING=0;}trap'cleanup_queue'0trap'cleanup_queue; exit 1'1215
finish_oldest(){["$RUNNING"-gt0]||return0set--$QUEUE;JOB=$1;shift;QUEUE="$*"PID=${JOB%%|*};REST=${JOB#*|};NAME=${REST%%|*};BZ2=${REST#*|}if!wait"$PID";thenrm-f"$DEST/$NAME""$DEST/$BZ2";echo"Decompression failed: $BZ2">&2;exit1;fiif!file_is_complete"$DEST/$NAME";thenSIZE=$(wc-c<"$DEST/$NAME"2>/dev/null|tr-d' '||echo0);rm-f"$DEST/$NAME""$DEST/$BZ2";echo"Unexpected file size: $DEST/$NAME ($SIZE bytes)">&2;exit1;firm-f"$DEST/$BZ2";echo"Ready: $NAME";RUNNING=$((RUNNING-1))}
start_decompress(){NAME=$1;BZ2=$2;rm-f"$DEST/$NAME";(cd"$DEST"&&bzip2-d"$BZ2")&PID=$!;QUEUE="${QUEUE}${QUEUE:+ }${PID}|${NAME}|${BZ2}";RUNNING=$((RUNNING+1));["$RUNNING"-lt"$JOBS"]||finish_oldest;}forHHin000102030405060708091011121314151617181920212223;doforMNin001020304050;doTIME="$DAY$HH$MN";NAME="$TIME.dwn.sw.flx.sfc.msm.1km.bin";BZ2="$NAME.bz2"iffile_is_complete"$DEST/$NAME";thenrm-f"$DEST/$BZ2";continue;fiif[-e"$DEST/$NAME"];thenSIZE=$(wc-c<"$DEST/$NAME"|tr-d' ');echo"Removing incomplete file: $NAME ($SIZE bytes)";rm-f"$DEST/$NAME";fiURL="$BASE/$YYYYMM/$DAY/$BZ2"if(cd"$DEST"&&"$WGET"-q-c"$URL");thenstart_decompress"$NAME""$BZ2";elserm-f"$DEST/$BZ2";fidonedonewhile["$RUNNING"-gt0];dofinish_oldest;donetrap-01215COUNT=$(find"$DEST"-maxdepth1-typef-name"$DAY*.dwn.sw.flx.sfc.msm.1km.bin"-size30262084c|wc-l|tr-d' ')["$COUNT"-gt0]||{echo"No solar-radiation files were downloaded for $DAY. Check the date or network connection.">&2;exit1;}echo"Ready: $DAY ($COUNT files, max $JOBS decompression jobs)"
make_daily_mean.sh Shell
What does it do? Prepares paths, recompiles Java when needed, and runs dailymean.java.
What does it do? Averages the available 10-minute fields within each UTC hour, then averages 24 hourly means. Fully dark hours with no solar-radiation files contribute 0 W/m².
importjava.io.*;importjava.nio.*;importjava.nio.file.*;importjava.util.*;importjava.util.stream.*;publicclassdailymean{publicstaticvoidmain(String[]args)throwsException{if(args.length!=2){System.err.println("Usage: dailymean input_day_directory output.bin");System.exit(1);}Pathdir=Paths.get(args[0]);Pathout=Paths.get(args[1]);if(!Files.isDirectory(dir))thrownewIOException("Missing directory: "+dir);List<Path>all;try(Stream<Path>s=Files.list(dir)){all=s.filter(p->p.getFileName().toString().matches("\\d{12}\\.dwn\\.sw\\.flx\\.sfc\\.msm\\.1km\\.bin")).sorted().collect(Collectors.toList());}if(all.isEmpty())thrownewIOException("No 10-minute files in "+dir);longnLong=FloatGrid.floatCount(all.get(0));if(nLong>Integer.MAX_VALUE)thrownewIOException("Grid too large");intn=(int)nLong;for(Pathp:all)if(FloatGrid.floatCount(p)!=nLong)thrownewIOException("Size mismatch: "+p);float[]daily=newfloat[n];float[]hour=newfloat[n];for(inthh=0;hh<24;hh++){finalStringhourKey=String.format("%02d",hh);List<Path>files=all.stream().filter(p->{Stringx=p.getFileName().toString();returnx.substring(8,10).equals(hourKey);}).collect(Collectors.toList());if(files.isEmpty()){// AMATERASS solar-radiation files are not produced during fully dark hours.// For a 24-hour daily mean, those hours contribute 0 W/m^2.System.out.printf("hour %02d: 0 files -> 0 W/m^2%n",hh);continue;}Arrays.fill(hour,0f);for(Pathp:files){MappedByteBufferb=FloatGrid.map(p);for(inti=0;i<n;i++)hour[i]+=b.getFloat(i*4);}floatinv=1.0f/files.size();for(inti=0;i<n;i++)daily[i]+=hour[i]*inv;System.out.printf("hour %02d: %d files%n",hh,files.size());}for(inti=0;i<n;i++)daily[i]/=24.0f;FloatGrid.writeFloats(out,daily);System.out.println("Created: "+out);}}
LEVEL 3 / Crop a region
MISSION 3: Crop a region
MISSION GOALDownload the 03:00 UTC 10-minute solar-radiation fields for July 19, 20, and 21, 2016, then crop only 137–140°E and 34–37°N from the 3001 × 2521 Japan-area grid. No averaging is performed here: only the spatial extent of the original data is reduced.
STEP 1Check the region
STEP 2Download 3 fields
STEP 3Crop all 3
STEP 4Compare maps
1
Check the latitude/longitude range
For this example, use 137°E–140°E and 34°N–37°N.
3001 × 2521
Japan areaAbout 30 MB
→
300 × 300
137–140°E 34–37°NAbout 0.35 MB
This keeps only the region of interest from the same solar-radiation field. No temporal averaging is performed.
Cropping with LAT/LNG: The crop bounds are passed as arguments to crop_solar.sh. crop.java first derives the available domain from the LAT / LNG grids and proceeds only when the requested rectangle is completely inside it. A partly out-of-range request is rejected instead of being silently clipped.
2
Download 03:00 UTC on July 19, 20, and 21
Use the same time on all three days. 03:00 UTC is 12:00 JST.
1. Download the required script
cd ~/amaterass_lab
wget -O download_solar.sh https://amaterass.science/science-lab/download_solar.sh
LEVEL 3 CLEAR You cropped and compared the same time on three different days without changing the data values by averaging.
Go one level deeper: what is running underneath?
If something does not work
If no crop is produced, verify that both the source solar field and LAT/LNG grids exist.
ls data/crop_source/
ls data/reference/
If you see ERROR: Requested crop is outside the available grid., part of the requested latitude/longitude range lies outside the msm.1km domain. Choose new bounds inside the displayed Available longitude / latitude range.
When the Java source is updated, crop_solar.sh automatically recompiles it if crop.java is newer than the class file.
Read the programs used in this LEVEL
These are the actual sources downloaded and executed by this page. You do not need to understand every line; start by tracing the inputs, the physical-data processing, and the outputs.
STEP 1Search LAT/LNG bounds
STEP 2Crop the same indices
STEP 3Compare with Tmap
download_solar.sh Shell
What does it do? Downloads one solar-radiation field into the crop-source directory.
#!/bin/shset-eu
select_wget(){ifcommand-vwget1>/dev/null2>&1;thenechowget1
elifcommand-vwget>/dev/null2>&1&&!wget--version2>&1|grep-q'Wget2';thenechowget
elseecho'Error: GNU Wget 1.x (wget or wget1) is required.'>&2exit1fi}["$#"-eq5]||{echo"Usage: $0 YYYY MM DD HH MN">&2;exit1;}YYYY=$1;MM=$2;DD=$3;HH=$4;MN=$5case"$YYYY"in[0-9][0-9][0-9][0-9]);;*)echo'YYYY must be four digits.'>&2;exit1;;esaccase"$MM"in0[1-9]|1[0-2]);;*)echo'MM must be 01-12.'>&2;exit1;;esaccase"$DD"in0[1-9]|[12][0-9]|3[01]);;*)echo'DD must be 01-31.'>&2;exit1;;esaccase"$HH"in[01][0-9]|2[0-3]);;*)echo'HH must be 00-23.'>&2;exit1;;esaccase"$MN"in00|10|20|30|40|50);;*)echo'MN must be one of 00,10,20,30,40,50.'>&2;exit1;;esacDAY="${YYYY}${MM}${DD}";TIME="${DAY}${HH}${MN}";YYYYMM="${YYYY}${MM}"EXPECTED=30262084WGET=$(select_wget)BASE=${AMATERASS_JP_BASE:-ftp://amaterass.cr.chiba-u.ac.jp/quasi-realtime/himawari829/archived/JP}DEST=data/crop_source;NAME="$TIME.dwn.sw.flx.sfc.msm.1km.bin";BZ2="$NAME.bz2";URL="$BASE/$YYYYMM/$DAY/$BZ2"
mkdir-p"$DEST"
file_is_complete(){FILE=$1;[-f"$FILE"]||return1;SIZE=$(wc-c<"$FILE"|tr-d' ');["$SIZE"-eq"$EXPECTED"];}iffile_is_complete"$DEST/$NAME";thenrm-f"$DEST/$BZ2"elseif[-e"$DEST/$NAME"];thenSIZE=$(wc-c<"$DEST/$NAME"|tr-d' ');echo"Removing incomplete file: $NAME ($SIZE bytes)";firm-f"$DEST/$NAME"(cd"$DEST"&&"$WGET"-c"$URL")(cd"$DEST"&&bzip2-d"$BZ2")fiif!file_is_complete"$DEST/$NAME";thenSIZE=$(wc-c<"$DEST/$NAME"2>/dev/null|tr-d' '||echo0);rm-f"$DEST/$NAME""$DEST/$BZ2";echo"Unexpected file size: $DEST/$NAME ($SIZE bytes)">&2;exit1;fi
rm-f"$DEST/$BZ2"echo"Ready: $DEST/$NAME"
crop_solar.sh Shell
What does it do? Passes the geographic bounds and source field to crop.java. If crop.java has been updated, it recompiles automatically, then crops the same [row,column] positions from LAT/LNG and solar radiation.
#!/bin/shset-eu
["$#"-eq9]||{echo"Usage: $0 YYYY MM DD HH MN WEST EAST SOUTH NORTH">&2;exit1;}YYYY=$1;MM=$2;DD=$3;HH=$4;MN=$5;WEST=$6;EAST=$7;SOUTH=$8;NORTH=$9TIME="${YYYY}${MM}${DD}${HH}${MN}"SRC=analysis.msm1km/crop.java;CLS=analysis.msm1km/crop.class
[-f"$SRC"]||{echo'Missing crop.java. Extract analysis_msm1km.tar.gz first.'>&2;exit1;}if[!-f"$CLS"]||["$SRC"-nt"$CLS"]||[analysis.msm1km/FloatGrid.java-nt"$CLS"];thenjavacanalysis.msm1km/*.java;fiLAT=data/reference/standard_2521x3001.lat.msm.1km.bin
LNG=data/reference/standard_2521x3001.lng.msm.1km.bin
[-f"$LAT"]&&[-f"$LNG"]||{echo'LAT/LNG files are required.'>&2;exit1;}IN="data/crop_source/$TIME.dwn.sw.flx.sfc.msm.1km.bin"OUT="data/crop/$TIME.dwn.sw.flx.sfc.msm.1km.crop.bin"[-f"$IN"]||{echo"Missing: $IN">&2;exit1;}
mkdir-pdata/crop
java-cpanalysis.msm1kmcrop"$IN""$LAT""$LNG""$WEST""$EAST""$SOUTH""$NORTH""$OUT"
crop.java Java
What does it do? Derives the available domain from the LAT/LNG grids, verifies that the requested rectangle is fully inside it, and only then extracts the matching rows and columns. Out-of-range requests are rejected rather than silently clipped.
importjava.io.*;importjava.nio.*;importjava.nio.channels.*;importjava.nio.file.*;importjava.util.*;publicclasscrop{staticfinalintNX=3001;staticfinalintNY=2521;staticfinaldoubleRANGE_EPS=1.0e-5;publicstaticvoidmain(String[]args)throwsException{if(args.length!=8){System.err.println("Usage: crop input lat lng west east south north output");System.exit(1);}Pathin=Paths.get(args[0]),latf=Paths.get(args[1]),lngf=Paths.get(args[2]),out=Paths.get(args[7]);doublewest=Double.parseDouble(args[3]),east=Double.parseDouble(args[4]);doublesouth=Double.parseDouble(args[5]),north=Double.parseDouble(args[6]);// Never leave an old crop behind when the current request fails.Files.deleteIfExists(out);Files.deleteIfExists(Paths.get(out.toString()+".grid.txt"));FloatGrid.requireSameSize(in,latf,lngf);if(FloatGrid.floatCount(in)!=(long)NX*NY)thrownewIOException("Expected 2521x3001 msm.1km grid");if(!Double.isFinite(west)||!Double.isFinite(east)||!Double.isFinite(south)||!Double.isFinite(north)){failInvalidBounds(west,east,south,north,"All crop bounds must be finite numbers.");}if(west>=east||south>=north){failInvalidBounds(west,east,south,north,"WEST must be smaller than EAST, and SOUTH must be smaller than NORTH.");}MappedByteBufferlat=FloatGrid.map(latf);MappedByteBufferlng=FloatGrid.map(lngf);// Derive the available geographic domain from the coordinate grids.floatfirstLat=lat.getFloat(0);floatlastLat=lat.getFloat(((NY-1)*NX+(NX-1))*4);floatfirstLon=lng.getFloat(0);floatlastLon=lng.getFloat(((NY-1)*NX+(NX-1))*4);doublelatStep=Math.abs(lat.getFloat(NX*4)-firstLat);doublelonStep=Math.abs(lng.getFloat(4)-firstLon);doublegridNorth=Math.max(firstLat,lastLat)+latStep/2.0;doublegridSouth=Math.min(firstLat,lastLat)-latStep/2.0;doublegridWest=Math.min(firstLon,lastLon)-lonStep/2.0;doublegridEast=Math.max(firstLon,lastLon)+lonStep/2.0;// The requested rectangle must be completely inside the data domain.// Do not silently clip a partly out-of-range request.if(west<gridWest-RANGE_EPS||east>gridEast+RANGE_EPS||south<gridSouth-RANGE_EPS||north>gridNorth+RANGE_EPS){failOutsideGrid(west,east,south,north,gridWest,gridEast,gridSouth,gridNorth);}intc0=-1,c1=-1,r0=-1,r1=-1;for(intc=0;c<NX;c++){floatlo=lng.getFloat(c*4);if(lo>=west&&lo<east){if(c0<0)c0=c;c1=c;}}for(intr=0;r<NY;r++){floatla=lat.getFloat((r*NX)*4);if(la<north&&la>=south){if(r0<0)r0=r;r1=r;}}if(c0<0||r0<0){System.err.println("ERROR: Requested crop contains no grid-cell centers.");System.err.printf(Locale.ROOT,"Requested longitude: %.3f .. %.3f E%n",west,east);System.err.printf(Locale.ROOT,"Requested latitude : %.3f .. %.3f N%n",south,north);System.err.printf(Locale.ROOT,"Grid spacing : %.3f deg (lon), %.3f deg (lat)%n",lonStep,latStep);System.exit(2);}intwidth=c1-c0+1,height=r1-r0+1;Files.createDirectories(out.toAbsolutePath().getParent());try(FileChannelsrc=FileChannel.open(in,StandardOpenOption.READ);FileChanneldst=FileChannel.open(out,StandardOpenOption.CREATE,StandardOpenOption.TRUNCATE_EXISTING,StandardOpenOption.WRITE)){ByteBufferrow=ByteBuffer.allocate(width*4);for(intr=r0;r<=r1;r++){row.clear();longpos=((long)r*NX+c0)*4L;intneed=width*4;while(row.position()<need){intx=src.read(row,pos+row.position());if(x<0)thrownewEOFException(in.toString());}row.flip();while(row.hasRemaining())dst.write(row);}}firstLat=lat.getFloat((r0*NX+c0)*4);lastLat=lat.getFloat((r1*NX+c0)*4);firstLon=lng.getFloat((r0*NX+c0)*4);lastLon=lng.getFloat((r0*NX+c1)*4);latStep=height>1?Math.abs(lat.getFloat(((r0+1)*NX+c0)*4)-firstLat):latStep;lonStep=width>1?Math.abs(lng.getFloat((r0*NX+c0+1)*4)-firstLon):lonStep;doublenorthBound=cleanBound(Math.max(firstLat,lastLat)+latStep/2.0);doublesouthBound=cleanBound(Math.min(firstLat,lastLat)-latStep/2.0);doublewestBound=cleanBound(Math.min(firstLon,lastLon)-lonStep/2.0);doubleeastBound=cleanBound(Math.max(firstLon,lastLon)+lonStep/2.0);Propertiesp=newProperties();p.setProperty("width",Integer.toString(width));p.setProperty("height",Integer.toString(height));p.setProperty("north",String.format(Locale.ROOT,"%.6f",northBound));p.setProperty("lat_span",String.format(Locale.ROOT,"%.6f",northBound-southBound));p.setProperty("lat_div","6");p.setProperty("west",String.format(Locale.ROOT,"%.6f",westBound));p.setProperty("lon_span",String.format(Locale.ROOT,"%.6f",eastBound-westBound));p.setProperty("lon_div","6");Pathmeta=Paths.get(out.toString()+".grid.txt");try(Writerw=Files.newBufferedWriter(meta)){for(Stringk:newString[]{"width","height","north","lat_span","lat_div","west","lon_span","lon_div"})w.write(k+"="+p.getProperty(k)+System.lineSeparator());}System.out.printf("source index : column=%d..%d row=%d..%d (0-based)%n",c0,c1,r0,r1);System.out.printf("grid : %d x %d%n",width,height);System.out.printf(Locale.ROOT,"grid centers : %.3fE..%.3fE / %.3fN..%.3fN%n",firstLon,lastLon,firstLat,lastLat);System.out.printf(Locale.ROOT,"grid bounds : %.3fE..%.3fE / %.3fN..%.3fN%n",westBound,eastBound,southBound,northBound);System.out.println("Created : "+out);}staticdoublecleanBound(doublevalue){returnMath.rint(value*10000.0)/10000.0;}staticvoidfailInvalidBounds(doublewest,doubleeast,doublesouth,doublenorth,Stringreason){System.err.println("ERROR: Invalid crop bounds.");System.err.println(reason);System.err.printf(Locale.ROOT,"Requested longitude: %.3f .. %.3f E%n",west,east);System.err.printf(Locale.ROOT,"Requested latitude : %.3f .. %.3f N%n",south,north);System.exit(2);}staticvoidfailOutsideGrid(doublewest,doubleeast,doublesouth,doublenorth,doublegridWest,doublegridEast,doublegridSouth,doublegridNorth){System.err.println("ERROR: Requested crop is outside the available grid.");System.err.printf(Locale.ROOT,"Requested longitude: %.3f .. %.3f E%n",west,east);System.err.printf(Locale.ROOT,"Requested latitude : %.3f .. %.3f N%n",south,north);System.err.printf(Locale.ROOT,"Available longitude: %.3f .. %.3f E%n",gridWest,gridEast);System.err.printf(Locale.ROOT,"Available latitude : %.3f .. %.3f N%n",gridSouth,gridNorth);System.exit(2);}}
LEVEL 4 / MONTHLY MEAN
MISSION 4: What appears when you average one month?
MISSION GOALPrepare all 31 daily means for August 2016 on the full msm.1km Japan grid (3001 × 2521), then create a monthly-mean solar-radiation map for the full domain. The regional crop from LEVEL 3 is not used here.
STEP 1Prepare 31 full-grid daily means
STEP 2Compute the full-grid monthly mean
STEP 3View the full Japan domain
1
Prepare 31 full-grid daily means
Prepare the 3001 × 2521 daily-mean files for August 1 through August 31 in data/daily/.
CHECK ls data/daily/201608*.dailymean.dwn.sw.flx.sfc.msm.1km.bin | wc -l should return 31.
If you do not have all 31 daily means
prepare_month.sh processes August one day at a time: download the 10-minute data, make the full-grid daily mean, delete that day's 10-minute files, and continue to the next day.
cd ~/amaterass_lab
chmod +x make_monthly_mean.sh
./make_monthly_mean.sh 2016 08
read: 20160801... ... Days used : 31 Created : data/monthly/201608.monthlymean.dwn.sw.flx.sfc.msm.1km.bin
✓
CHECK If Days used : 31 is displayed, the monthly mean was created from all 31 days of August.
3
View the monthly mean over the full Japan domain
Map the full msm.1km Japan domain and look for spatial differences that remain after averaging a month.
THINK: What regional differences in monthly-mean solar radiation can you see across the full Japan domain? Compared with a single daily map, which broad features remain and which fine-scale variations are smoothed out?
cd ~/amaterass_lab
./draw_map.sh data/monthly/201608.monthlymean.dwn.sw.flx.sfc.msm.1km.bin 400 0 4 "W/m²"
✓
LEVEL 4 CLEAR You created and viewed a monthly mean over the full Japan domain.
Go one level deeper: what is running underneath?
If something does not work
If the 31 daily files are not ready, count them first:
ls data/daily/201608*.dailymean.dwn.sw.flx.sfc.msm.1km.bin | wc -l
If the result is not 31, rerun prepare_month.sh. Complete days are reported as Already exists: and only missing days are processed.
./prepare_month.sh 2016 08
If the Java source itself is missing, extract and compile the analysis package:
tar xzf analysis_msm1km.tar.gz
javac analysis.msm1km/*.java
Read the programs used in this LEVEL
These are the actual sources downloaded and executed by this page. You do not need to understand every line; start by tracing the inputs, the physical-data processing, and the outputs.
STEP 1Build each daily mean
STEP 2Check required days
STEP 3Monthly mean
prepare_month.sh Shell
What does it do? Determines the number of days in the month and runs download_day.sh → make_daily_mean.sh for each day. Complete existing daily means are reused.
#!/bin/shset-eu
["$#"-eq2]||["$#"-eq3]||{echo"Usage: $0 YYYY MM [DECOMP_JOBS]">&2;exit1;}YYYY=$1;MM=$2;JOBS=${3:-4};MONTH="${YYYY}${MM}";EXPECTED=30262084case"$JOBS"in''|*[!0-9]*)echo'DECOMP_JOBS must be a positive integer.'>&2;exit1;;esacSRC=analysis.msm1km/dailymean.java;CLS=analysis.msm1km/dailymean.class
[-f"$SRC"]||{echo'Missing dailymean.java. Extract analysis_msm1km.tar.gz first.'>&2;exit1;}if[!-f"$CLS"]||["$SRC"-nt"$CLS"]||[analysis.msm1km/FloatGrid.java-nt"$CLS"];thenjavacanalysis.msm1km/*.java;fi
mkdir-pdata/daily_rawdata/daily
case"$MM"in01|03|05|07|08|10|12)LAST=31;;04|06|09|11)LAST=30;;02)if[$((YYYY%400))-eq0]||{[$((YYYY%4))-eq0]&&[$((YYYY%100))-ne0];};thenLAST=29;elseLAST=28;fi;;*)echo'MM must be 01-12.'>&2;exit1;;esacN=1while["$N"-le"$LAST"];doDD=$(printf'%02d'"$N");DAY="${YYYY}${MM}${DD}";RAW="data/daily_raw/$DAY";DAILY="data/daily/$DAY.dailymean.dwn.sw.flx.sfc.msm.1km.bin";COMPLETE=0if[-f"$DAILY"];thenSIZE=$(wc-c<"$DAILY"|tr-d' ');if["$SIZE"-eq"$EXPECTED"];thenCOMPLETE=1;echo"Already exists: $DAILY";elseecho"Removing incomplete daily mean: $DAILY ($SIZE bytes)";rm-f"$DAILY";fi;fiif["$COMPLETE"-eq0];then./download_day.sh"$YYYY""$MM""$DD""$JOBS";./make_daily_mean.sh"$YYYY""$MM""$DD";firm-rf"$RAW";N=$((N+1))doneecho"$LAST full-grid daily-mean files ready in data/daily/."
make_monthly_mean.sh Shell
What does it do? Sets the monthly input/output paths, recompiles Java if necessary, and calls monthlymean.java.
What does it do? Checks that the expected number of daily means exists (31 for August), then averages the grids pixel by pixel.
importjava.io.*;importjava.nio.*;importjava.nio.file.*;importjava.time.*;importjava.time.format.*;importjava.util.*;importjava.util.stream.*;publicclassmonthlymean{publicstaticvoidmain(String[]args)throwsException{if(args.length!=3){System.err.println("Usage: monthlymean input_dir YYYYMM output.bin");System.exit(1);}Pathdir=Paths.get(args[0]);Stringmonth=args[1];Pathout=Paths.get(args[2]);YearMonthym;try{ym=YearMonth.parse(month,DateTimeFormatter.ofPattern("yyyyMM"));}catch(DateTimeExceptione){thrownewIOException("YYYYMM must be a valid month: "+month,e);}Stringsuffix=".dailymean.dwn.sw.flx.sfc.msm.1km.bin";List<Path>files;try(Stream<Path>s=Files.list(dir)){files=s.filter(p->p.getFileName().toString().startsWith(month)).filter(p->p.getFileName().toString().endsWith(suffix)).sorted().collect(Collectors.toList());}intexpected=ym.lengthOfMonth();if(files.size()!=expected)thrownewIOException("Expected "+expected+" daily files, found "+files.size());longnLong=FloatGrid.floatCount(files.get(0));if(nLong>Integer.MAX_VALUE)thrownewIOException("Grid too large");intn=(int)nLong;float[]sum=newfloat[n];for(Pathp:files){if(FloatGrid.floatCount(p)!=nLong)thrownewIOException("Size mismatch: "+p);if(!FloatGrid.sameGridMeta(files.get(0),p))thrownewIOException("Grid metadata mismatch: "+p);MappedByteBufferb=FloatGrid.map(p);for(inti=0;i<n;i++)sum[i]+=b.getFloat(i*4);System.out.println("read: "+p.getFileName());}for(inti=0;i<n;i++)sum[i]/=files.size();FloatGrid.writeFloats(out,sum);FloatGrid.copyGridMeta(files.get(0),out);System.out.println("Days used : "+files.size());System.out.println("Created : "+out);}}
LEVEL 5 / ANOMALY
MISSION 5: How did August 20 differ from the August 2016 mean across the full Japan domain?
MISSION GOALSubtract the full-domain August monthly mean from the full-domain daily mean for August 20, 2016. On the 3001 × 2521 grid, map where solar radiation was higher or lower than the August 2016 mean.
STEP 1Think about the difference
STEP 2Compute the full-grid anomaly
STEP 3View the full Japan domain
1
Calculate daily mean − monthly mean
Both fields use the same 3001 × 2521 msm.1km Japan grid, so corresponding grid cells can be subtracted directly.
August 20 daily meanFull Japan domain
−
August monthly meanFull Japan domain
→
±
AnomalyDifference from mean
Positive values mean more solar radiation than the August 2016 mean; negative values mean less.
Anomaly: Here the reference is the monthly mean for the same August 2016, not a climatological normal.
2
Create the full-domain anomaly file
Subtract corresponding cells of the August 20 daily mean and the August monthly mean on the full 3001 × 2521 grid.
Before you calculate: Which parts of the Japan domain do you expect to have more solar radiation than the August 2016 mean, and which parts less?
1. Download the required file in the working directory
cd ~/amaterass_lab
wget -O make_anomaly.sh https://amaterass.science/science-lab/make_anomaly.sh
cd ~/amaterass_lab
chmod +x make_anomaly.sh
./make_anomaly.sh 2016 08 20
✓
CHECK data/anomaly/20160820.anomaly.dwn.sw.flx.sfc.msm.1km.bin should be created.
3
Map the anomaly over the full Japan domain
Use a symmetric range around zero so positive and negative anomalies can be compared directly.
Negative anomalyBelow August mean
0Near August mean
Positive anomalyAbove August mean
First confirm that 0 W/m² is at the center of the color scale.
Final question: Across the full Japan domain, where was solar radiation higher than the August 2016 mean on August 20, and where was it lower? What large-scale pattern can you see in the anomaly?
cd ~/amaterass_lab
./draw_map.sh data/anomaly/20160820.anomaly.dwn.sw.flx.sfc.msm.1km.bin 200 -200 8 "W/m²"
✓
LEVEL 5 CLEAR You mapped how the August 20 daily mean differed from the August 2016 mean across the full Japan domain.
Go one level deeper: what is running underneath?
If something does not work
If the anomaly cannot be created, confirm that both required inputs exist: the selected daily mean and the monthly mean.
ls -lh data/daily/20160820.dailymean.dwn.sw.flx.sfc.msm.1km.bin
ls -lh data/monthly/201608.monthlymean.dwn.sw.flx.sfc.msm.1km.bin
Read the programs used in this LEVEL
These are the actual sources downloaded and executed by this page. You do not need to understand every line; start by tracing the inputs, the physical-data processing, and the outputs.
STEP 1Read daily mean
STEP 2Read monthly mean
STEP 3Calculate difference
make_anomaly.sh Shell
What does it do? Passes the selected daily mean and the corresponding monthly mean to anomaly.java and prepares the output path.
What does it do? Calculates daily mean − monthly mean at every grid point. Positive values are above the monthly mean; negative values are below it.
importjava.io.*;importjava.nio.*;importjava.nio.file.*;publicclassanomaly{publicstaticvoidmain(String[]args)throwsException{if(args.length!=3){System.err.println("Usage: anomaly daily.bin monthly.bin output.bin");System.exit(1);}Pathdaily=Paths.get(args[0]),monthly=Paths.get(args[1]),out=Paths.get(args[2]);FloatGrid.requireSameSize(daily,monthly);if(!FloatGrid.sameGridMeta(daily,monthly))thrownewIOException("Grid metadata mismatch");longnLong=FloatGrid.floatCount(daily);if(nLong>Integer.MAX_VALUE)thrownewIOException("Grid too large");intn=(int)nLong;MappedByteBuffera=FloatGrid.map(daily),b=FloatGrid.map(monthly);float[]d=newfloat[n];for(inti=0;i<n;i++)d[i]=a.getFloat(i*4)-b.getFloat(i*4);FloatGrid.writeFloats(out,d);FloatGrid.copyGridMeta(daily,out);System.out.println("Created: "+out);}}
LEVEL 6 / POINT TIME SERIES
MISSION 6: Follow one location through a day
MISSION GOALSelect one location by latitude and longitude from the 3001 × 2521 grid and extract a one-day solar-radiation time series. The horizontal axis uses the actual observation time calculated from the TIME value at the same pixel, not simply the timestamp in the filename.
STEP 1Download one day
STEP 2Select one grid cell
STEP 3Read time from TIME
STEP 4Plot with Gnuplot
1
Download one day of solar radiation and TIME
Download the 10-minute data corresponding to August 20, 2016 in JST. For each available solar-radiation file, the matching TIME file is downloaded as well.
CHECK Solar-radiation and TIME files should appear in data/timeseries/20160820/.
2
Select the nearest grid cell from latitude and longitude
For this example, specify 35.0°N, 138.0°E. The LAT/LNG grids are searched to find the closest pixel.
Run
cd ~/amaterass_lab
./pickup_day.sh 2016 08 20 35.0 138.0
selected grid : ... N, ... E (row=... column=...) samples : ... Created : data/timeseries/20160820/solar.dat
Why use TIME? Himawari does not observe every pixel of the full image at exactly the same instant. The timestamps in solar.dat are therefore calculated from the TIME value at the selected pixel and converted to actual observation time in JST.
3
Plot the daily variation with Gnuplot
Instead of a map, plot actual observation time on the x-axis and downward shortwave flux [W/m²] on the y-axis.
Run
cd ~/amaterass_lab
./plot_solar_day.sh 2016 08 20
✓
LEVEL 6 CLEAR data/timeseries/20160820/solar_timeseries.png should be created. You can now see the satellite-derived physical quantity as a numerical time series.
Go one level deeper: what is running underneath?
If something does not work
If the time series cannot be produced, check that solar and TIME files exist for matching timestamps and that the point-series source is available.
ls data/timeseries/20160820/*dwn.sw.flx.sfc* | head
ls data/timeseries/20160820/*grd.time.mjd.hms* | head
ls analysis.msm1km/pointseries.java
pickup_day.sh can refresh the analysis package automatically when an older working directory does not contain pointseries.java.
Read the programs used in this LEVEL
These are the actual sources downloaded and executed by this page. You do not need to understand every line; start by tracing the inputs, the physical-data processing, and the outputs.
STEP 1Lat/lon → nearest pixel
STEP 2Read solar + TIME
STEP 3Gnuplot time series
download_point_day.sh Shell
What does it do? Converts one JST day to UTC and downloads available solar-radiation fields together with their matching TIME fields, because the time series reads both at the same pixel.
#!/bin/shset-eu
select_wget(){ifcommand-vwget1>/dev/null2>&1;thenechowget1
elifcommand-vwget>/dev/null2>&1&&!wget--version2>&1|grep-q'Wget2';thenechowget
elseecho'Error: GNU Wget 1.x (wget or wget1) is required.'>&2exit1fi}["$#"-eq3]||["$#"-eq4]||{echo"Usage: $0 YYYY MM DD [DECOMP_JOBS]">&2;exit1;}YYYY=$1;MM=$2;DD=$3;JOBS=${4:-4}case"$JOBS"in''|*[!0-9]*)echo'DECOMP_JOBS must be a positive integer.'>&2;exit1;;esac["$JOBS"-ge1]||{echo'DECOMP_JOBS must be at least 1.'>&2;exit1;}DAY="${YYYY}${MM}${DD}"CHECK=$(date-u-d"${YYYY}-${MM}-${DD}"+%Y%m%d2>/dev/null||true)["$CHECK"="$DAY"]||{echo'Invalid calendar date.'>&2;exit1;}EXPECTED=30262084WGET=$(select_wget)BASE=${AMATERASS_JP_BASE:-ftp://amaterass.cr.chiba-u.ac.jp/quasi-realtime/himawari829/archived/JP}DEST="data/timeseries/$DAY"
mkdir-p"$DEST"
file_is_complete(){FILE=$1[-f"$FILE"]||return1SIZE=$(wc-c<"$FILE"|tr-d' ')["$SIZE"-eq"$EXPECTED"]}QUEUE=RUNNING=0
cleanup_queue(){forJOBin$QUEUE;doPID=${JOB%%|*};REST=${JOB#*|};NAME=${REST%%|*};BZ2=${REST#*|}kill"$PID"2>/dev/null||truewait"$PID"2>/dev/null||truerm-f"$DEST/$NAME""$DEST/$BZ2"doneQUEUE=;RUNNING=0}trap'cleanup_queue'0trap'cleanup_queue; exit 1'1215
finish_oldest(){["$RUNNING"-gt0]||return0set--$QUEUEJOB=$1;shift;QUEUE="$*"PID=${JOB%%|*};REST=${JOB#*|};NAME=${REST%%|*};BZ2=${REST#*|}if!wait"$PID";thenrm-f"$DEST/$NAME""$DEST/$BZ2"echo"Decompression failed: $BZ2">&2exit1fiif!file_is_complete"$DEST/$NAME";thenSIZE=$(wc-c<"$DEST/$NAME"2>/dev/null|tr-d' '||echo0)rm-f"$DEST/$NAME""$DEST/$BZ2"echo"Unexpected file size: $DEST/$NAME ($SIZE bytes)">&2exit1firm-f"$DEST/$BZ2"echo"Ready: $NAME"RUNNING=$((RUNNING-1))}
start_decompress(){NAME=$1;BZ2=$2rm-f"$DEST/$NAME"(cd"$DEST"&&bzip2-d"$BZ2")&PID=$!QUEUE="${QUEUE}${QUEUE:+ }${PID}|${NAME}|${BZ2}"RUNNING=$((RUNNING+1))if["$RUNNING"-ge"$JOBS"];thenfinish_oldest;fi}
fetch_file(){NAME=$1;URL=$2BZ2="$NAME.bz2"iffile_is_complete"$DEST/$NAME";thenrm-f"$DEST/$BZ2"return0fiif[-e"$DEST/$NAME"];thenSIZE=$(wc-c<"$DEST/$NAME"|tr-d' ')echo"Removing incomplete file: $NAME ($SIZE bytes)"rm-f"$DEST/$NAME"fiif(cd"$DEST"&&"$WGET"-q-c"$URL");thenstart_decompress"$NAME""$BZ2"return0firm-f"$DEST/$BZ2"return1}START=$(date-u-d"${YYYY}-${MM}-${DD} 00:00 +0900"+%s)END=$(date-u-d"${YYYY}-${MM}-${DD} 23:50 +0900"+%s)T=$STARTFOUND=0while["$T"-le"$END"];doSTAMP=$(date-u-d"@$T"+%Y%m%d%H%M)YYYYMM=$(printf'%s'"$STAMP"|cut-c1-6)YYYYMMDD=$(printf'%s'"$STAMP"|cut-c1-8)DIR="$BASE/$YYYYMM/$YYYYMMDD"SOLAR="$STAMP.dwn.sw.flx.sfc.msm.1km.bin"TIME="$STAMP.grd.time.mjd.hms.msm.1km.bin"iffile_is_complete"$DEST/$SOLAR"||fetch_file"$SOLAR""$DIR/$SOLAR.bz2";thenFOUND=$((FOUND+1))file_is_complete"$DEST/$TIME"||fetch_file"$TIME""$DIR/$TIME.bz2"||{echo"Missing TIME file for $STAMP">&2;exit1;}fiT=$((T+600))donewhile["$RUNNING"-gt0];dofinish_oldest;donetrap-01215COUNT=$(find"$DEST"-maxdepth1-typef-name'*.dwn.sw.flx.sfc.msm.1km.bin'-size30262084c|wc-l|tr-d' ')["$COUNT"-gt1]||{echo"Not enough solar-radiation files for $DAY.">&2;exit1;}echo"Time-series source files ready: $DAY ($COUNT solar files, max $JOBS decompression jobs)"
pickup_day.sh Shell
What does it do? Passes LAT/LNG plus the solar/TIME files to pointseries.java and creates solar.dat. It can also refresh the analysis source in an older working directory.
#!/bin/shset-eu
["$#"-eq5]||{echo"Usage: $0 YYYY MM DD LAT LON">&2;exit1;}YYYY=$1;MM=$2;DD=$3;LAT=$4;LON=$5;DAY="${YYYY}${MM}${DD}"DIR="data/timeseries/$DAY";LATF=data/reference/standard_2521x3001.lat.msm.1km.bin;LNGF=data/reference/standard_2521x3001.lng.msm.1km.bin
[-d"$DIR"]||{echo"Missing: $DIR">&2;exit1;}[-f"$LATF"]&&[-f"$LNGF"]||{echo'Missing LAT/LNG reference files. Run ./download_reference.sh first.'>&2;exit1;}SRC=analysis.msm1km/pointseries.java;CLS=analysis.msm1km/pointseries.class
if[!-f"$SRC"];thenecho"Refreshing analysis programs..."wget-q-Oanalysis_msm1km.tar.gzhttps://amaterass.science/science-lab/analysis_msm1km.tar.gz
tarxzfanalysis_msm1km.tar.gz
fi[-f"$SRC"]||{echo"Could not prepare $SRC">&2;exit1;}if[!-f"$CLS"]||["$SRC"-nt"$CLS"]||[analysis.msm1km/FloatGrid.java-nt"$CLS"];thenjavacanalysis.msm1km/*.java;fi
java-cpanalysis.msm1kmpointseries"$DIR""$LATF""$LNGF""$DAY""$LAT""$LON"dwn.sw.flx.sfc.msm.1km.bin"$DIR/solar.dat"
plot_solar_day.sh Shell
What does it do? Uses Gnuplot to plot actual observation time in JST against solar radiation. The default y-range is 0–1400 W/m² and solar radiation is orange.
#!/bin/shset-eu
["$#"-ge3]&&["$#"-le4]||{echo"Usage: $0 YYYY MM DD [SOLAR_MAX]">&2;exit1;}SOLAR_MAX="${4:-1400}"DAY="${1}${2}${3}";DIR="data/timeseries/$DAY";DAT="$DIR/solar.dat";OUT="$DIR/solar_timeseries.png"[-f"$DAT"]||{echo"Missing: $DAT">&2;exit1;}command-vgnuplot>/dev/null2>&1||{echo'Gnuplot is required.'>&2;exit1;}
gnuplot<<EOF_GPset terminal pngcairo size 1200,650 enhanced font "sans,16"set output "$OUT"set xdata timeset timefmt "%Y-%m-%dT%H:%M:%S"set format x "%H:%M"set xlabel "Time (JST)"set ylabel "Downward shortwave flux (W/m^2)"set gridset key offset yrange [0:$SOLAR_MAX]plot "$DAT" using 1:2 with lines linewidth 2 linecolor rgb "#E69F00"EOF_GPecho"Created: $OUT"
pointseries.java Java
What does it do? Finds the nearest grid point once, then reads the physical value and TIME from that same index for each file. TIME is converted from UTC to JST and only samples belonging to the requested local date are written.
importjava.io.*;importjava.nio.*;importjava.nio.file.*;importjava.time.*;importjava.time.format.*;importjava.util.*;importjava.util.regex.*;importjava.util.stream.*;publicclasspointseries{staticfinalintNX=3001;staticfinalintNY=2521;staticfinalStringTIME_SUFFIX="grd.time.mjd.hms.msm.1km.bin";publicstaticvoidmain(String[]args)throwsException{if(args.length!=8){System.err.println("Usage: pointseries input_dir lat.bin lng.bin YYYYMMDD target_lat target_lon data_suffix output.dat");System.exit(1);}Pathdir=Paths.get(args[0]),latf=Paths.get(args[1]),lngf=Paths.get(args[2]);LocalDatetargetDate=LocalDate.parse(args[3],DateTimeFormatter.BASIC_ISO_DATE);doubletargetLat=Double.parseDouble(args[4]),targetLon=Double.parseDouble(args[5]);Stringsuffix=args[6];Pathout=Paths.get(args[7]);if(!Files.isDirectory(dir))thrownewIOException("Missing directory: "+dir);FloatGrid.requireSameSize(latf,lngf);if(FloatGrid.floatCount(latf)!=(long)NX*NY)thrownewIOException("Expected 2521x3001 msm.1km coordinate grid");MappedByteBufferlat=FloatGrid.map(latf),lng=FloatGrid.map(lngf);doublebest=Double.POSITIVE_INFINITY;intbestIndex=-1;floatbestLat=Float.NaN,bestLon=Float.NaN;for(inti=0;i<NX*NY;i++){floatla=lat.getFloat(i*4),lo=lng.getFloat(i*4);if(!Float.isFinite(la)||!Float.isFinite(lo))continue;doubledlat=la-targetLat;doubledlon=(lo-targetLon)*Math.cos(Math.toRadians(targetLat));doubled2=dlat*dlat+dlon*dlon;if(d2<best){best=d2;bestIndex=i;bestLat=la;bestLon=lo;}}if(bestIndex<0)thrownewIOException("No valid coordinate found");Patternpattern=Pattern.compile("\\d{12}\\."+Pattern.quote(suffix));List<Path>files;try(Stream<Path>s=Files.list(dir)){files=s.filter(p->pattern.matcher(p.getFileName().toString()).matches()).sorted().collect(Collectors.toList());}if(files.isEmpty())thrownewIOException("No files for "+suffix+" in "+dir);Files.createDirectories(out.toAbsolutePath().getParent());ZoneIdjst=ZoneId.of("Asia/Tokyo");DateTimeFormatteroutFmt=DateTimeFormatter.ofPattern("yyyy-MM-dd'T'HH:mm:ss");intcount=0;try(PrintWriterw=newPrintWriter(Files.newBufferedWriter(out))){introw=bestIndex/NX,col=bestIndex%NX;w.printf(Locale.ROOT,"# target_lat=%.6f target_lon=%.6f%n",targetLat,targetLon);w.printf(Locale.ROOT,"# grid_lat=%.6f grid_lon=%.6f row=%d column=%d%n",bestLat,bestLon,row,col);w.println("# time_JST value");for(Pathdata:files){Stringname=data.getFileName().toString();Stringstamp=name.substring(0,12);Pathtime=dir.resolve(stamp+"."+TIME_SUFFIX);if(!Files.isRegularFile(time))continue;FloatGrid.requireSameSize(data,time,latf);floatvalue=FloatGrid.readAt(data,bestIndex);floatdays=FloatGrid.readAt(time,bestIndex);if(!Float.isFinite(value)||!Float.isFinite(days))continue;LocalDateutcDate=LocalDate.parse(stamp.substring(0,8),DateTimeFormatter.BASIC_ISO_DATE);longmillis=Math.round(days*86400.0*1000.0);Instantinstant=utcDate.atStartOfDay(ZoneOffset.UTC).toInstant().plusMillis(millis);ZonedDateTimelocal=instant.atZone(jst);if(!local.toLocalDate().equals(targetDate))continue;w.printf(Locale.ROOT,"%s %.6f%n",outFmt.format(local),value);count++;}}if(count<2){Files.deleteIfExists(out);thrownewIOException("Not enough samples on "+targetDate+" ("+count+")");}System.out.printf(Locale.ROOT,"selected grid : %.6f N, %.6f E (row=%d column=%d)%n",bestLat,bestLon,bestIndex/NX,bestIndex%NX);System.out.println("samples : "+count);System.out.println("Created : "+out);}}
LEVEL 7 / SOLAR TO PV
MISSION 7: How does solar radiation connect to photovoltaic output?
MISSION GOALExtract AMATERASS estimated PV output for the same location and day as LEVEL 6. Compare solar radiation [W/m²] with PV output [kW/kWp], then integrate both time series to obtain daily solar energy and estimated energy yield per 1 kWp.
STEP 1Download PV output
STEP 2Compare two time series
STEP 3Integrate one day
1
Download AMATERASS estimated PV output
Use unit.pvp.tc028.ac945.sfc, the estimated output per 1 kWp [kW/kWp] calculated with a temperature coefficient of −0.28 %/°C and inverter efficiency of 94.5%.
Reading unit.pvp: A value of 0.8 means an estimated output of about 0.8 kW from a 1 kWp PV system at that time and grid cell.
2
Compare solar radiation and PV output with Gnuplot
Because the quantities have different units, plot them in two panels with the same time axis. Both use actual observation times derived from TIME.
Run
cd ~/amaterass_lab
./plot_solar_pv.sh 2016 08 20
✓
CHECK Open data/timeseries/20160820/solar_pv_timeseries.png and compare how the two physical quantities rise and fall through the day.
3
Convert instantaneous values into daily energy
Integrate along the actual observation times to convert the time series into daily totals.
Run
cd ~/amaterass_lab
./daily_energy.sh 2016 08 20
Solar energy : ... kWh/m^2 PV energy : ... kWh/kWp Samples : solar=... pv=...
Think: Solar energy [kWh/m²] and PV energy yield [kWh/kWp] are not the same physical quantity. How did the shape of the time series and the daily totals change as solar radiation was converted into estimated PV output?
✓
ALL LEVELS CLEAR You moved beyond satellite images to extract physical quantities at one point, follow them in time, and connect solar radiation to photovoltaic energy.
Go one level deeper: what is running underneath?
If something does not work
If the PV comparison is missing, first check the extracted text data.
ls -lh data/timeseries/20160820/solar.dat
ls -lh data/timeseries/20160820/pv.dat
If PV fields are missing, download and extract them again for the same timestamps used in LEVEL 6.
These are the actual sources downloaded and executed by this page. You do not need to understand every line; start by tracing the inputs, the physical-data processing, and the outputs.
STEP 1Download PV at same times
STEP 2Compare solar and PV
STEP 3Integrate to kWh
download_pv_day.sh Shell
What does it do? Uses the solar-radiation timestamps already present from LEVEL 6 to download matching unit.pvp.tc028.ac945.sfc fields. Network transfer stays single-stream and decompression uses up to four jobs.
#!/bin/shset-eu
select_wget(){ifcommand-vwget1>/dev/null2>&1;thenechowget1
elifcommand-vwget>/dev/null2>&1&&!wget--version2>&1|grep-q'Wget2';thenechowget
elseecho'Error: GNU Wget 1.x (wget or wget1) is required.'>&2;exit1fi}["$#"-eq3]||["$#"-eq4]||{echo"Usage: $0 YYYY MM DD [DECOMP_JOBS]">&2;exit1;}YYYY=$1;MM=$2;DD=$3;JOBS=${4:-4};DAY="${YYYY}${MM}${DD}"case"$JOBS"in''|*[!0-9]*)echo'DECOMP_JOBS must be a positive integer.'>&2;exit1;;esac["$JOBS"-ge1]||{echo'DECOMP_JOBS must be at least 1.'>&2;exit1;}EXPECTED=30262084;WGET=$(select_wget)BASE=${AMATERASS_JP_BASE:-ftp://amaterass.cr.chiba-u.ac.jp/quasi-realtime/himawari829/archived/JP}DEST="data/timeseries/$DAY"[-d"$DEST"]||{echo"Missing: $DEST (run download_point_day.sh first)">&2;exit1;}
file_is_complete(){FILE=$1;[-f"$FILE"]||return1;SIZE=$(wc-c<"$FILE"|tr-d' ');["$SIZE"-eq"$EXPECTED"];}QUEUE=;RUNNING=0
cleanup_queue(){forJOBin$QUEUE;doPID=${JOB%%|*};REST=${JOB#*|};NAME=${REST%%|*};BZ2=${REST#*|};kill"$PID"2>/dev/null||true;wait"$PID"2>/dev/null||true;rm-f"$DEST/$NAME""$DEST/$BZ2";done;QUEUE=;RUNNING=0;}trap'cleanup_queue'0trap'cleanup_queue; exit 1'1215
finish_oldest(){["$RUNNING"-gt0]||return0set--$QUEUE;JOB=$1;shift;QUEUE="$*"PID=${JOB%%|*};REST=${JOB#*|};NAME=${REST%%|*};BZ2=${REST#*|}if!wait"$PID";thenrm-f"$DEST/$NAME""$DEST/$BZ2";echo"Decompression failed: $BZ2">&2;exit1;fiif!file_is_complete"$DEST/$NAME";thenSIZE=$(wc-c<"$DEST/$NAME"2>/dev/null|tr-d' '||echo0);rm-f"$DEST/$NAME""$DEST/$BZ2";echo"Unexpected file size: $DEST/$NAME ($SIZE bytes)">&2;exit1;firm-f"$DEST/$BZ2";echo"Ready: $NAME";RUNNING=$((RUNNING-1))}
start_decompress(){NAME=$1;BZ2=$2;rm-f"$DEST/$NAME";(cd"$DEST"&&bzip2-d"$BZ2")&PID=$!;QUEUE="${QUEUE}${QUEUE:+ }${PID}|${NAME}|${BZ2}";RUNNING=$((RUNNING+1));["$RUNNING"-lt"$JOBS"]||finish_oldest;}COUNT=0forSOLARin"$DEST"/*.dwn.sw.flx.sfc.msm.1km.bin;do[-f"$SOLAR"]||continueSTAMP=$(basename"$SOLAR"|cut-c1-12);YYYYMM=$(printf'%s'"$STAMP"|cut-c1-6);YYYYMMDD=$(printf'%s'"$STAMP"|cut-c1-8)NAME="$STAMP.unit.pvp.tc028.ac945.sfc.msm.1km.bin";BZ2="$NAME.bz2"iffile_is_complete"$DEST/$NAME";thenrm-f"$DEST/$BZ2";COUNT=$((COUNT+1));continue;fiif[-e"$DEST/$NAME"];thenSIZE=$(wc-c<"$DEST/$NAME"|tr-d' ');echo"Removing incomplete file: $NAME ($SIZE bytes)";rm-f"$DEST/$NAME";fiURL="$BASE/$YYYYMM/$YYYYMMDD/$BZ2"if(cd"$DEST"&&"$WGET"-q-c"$URL");thenstart_decompress"$NAME""$BZ2";COUNT=$((COUNT+1));elserm-f"$DEST/$BZ2";fidonewhile["$RUNNING"-gt0];dofinish_oldest;donetrap-01215["$COUNT"-gt1]||{echo"Not enough PV files for $DAY.">&2;exit1;}echo"PV files ready: $DAY ($COUNT files, max $JOBS decompression jobs)"
pickup_pv_day.sh Shell
What does it do? Extracts both solar radiation and PV output at the same latitude/longitude, producing solar.dat and pv.dat.
#!/bin/shset-eu
["$#"-eq5]||{echo"Usage: $0 YYYY MM DD LAT LON">&2;exit1;}YYYY=$1;MM=$2;DD=$3;LAT=$4;LON=$5;DAY="${YYYY}${MM}${DD}"DIR="data/timeseries/$DAY";LATF=data/reference/standard_2521x3001.lat.msm.1km.bin;LNGF=data/reference/standard_2521x3001.lng.msm.1km.bin
[-d"$DIR"]||{echo"Missing: $DIR">&2;exit1;}[-f"$LATF"]&&[-f"$LNGF"]||{echo'Missing LAT/LNG reference files. Run ./download_reference.sh first.'>&2;exit1;}SRC=analysis.msm1km/pointseries.java;CLS=analysis.msm1km/pointseries.class
if[!-f"$SRC"];thenecho"Refreshing analysis programs..."wget-q-Oanalysis_msm1km.tar.gzhttps://amaterass.science/science-lab/analysis_msm1km.tar.gz
tarxzfanalysis_msm1km.tar.gz
fi[-f"$SRC"]||{echo"Could not prepare $SRC">&2;exit1;}if[!-f"$CLS"]||["$SRC"-nt"$CLS"]||[analysis.msm1km/FloatGrid.java-nt"$CLS"];thenjavacanalysis.msm1km/*.java;fi
java-cpanalysis.msm1kmpointseries"$DIR""$LATF""$LNGF""$DAY""$LAT""$LON"dwn.sw.flx.sfc.msm.1km.bin"$DIR/solar.dat"
java-cpanalysis.msm1kmpointseries"$DIR""$LATF""$LNGF""$DAY""$LAT""$LON"unit.pvp.tc028.ac945.sfc.msm.1km.bin"$DIR/pv.dat"
plot_solar_pv.sh Shell
What does it do? Plots solar radiation (orange, 0–1400 W/m²) and PV output (blue, 0–1.2 kW/kWp) in two Gnuplot panels sharing the same time axis.
#!/bin/shset-eu
["$#"-ge3]&&["$#"-le5]||{echo"Usage: $0 YYYY MM DD [SOLAR_MAX] [PV_MAX]">&2;exit1;}SOLAR_MAX="${4:-1400}"PV_MAX="${5:-1.2}"DAY="${1}${2}${3}";DIR="data/timeseries/$DAY";SOLAR="$DIR/solar.dat";PV="$DIR/pv.dat";OUT="$DIR/solar_pv_timeseries.png"[-f"$SOLAR"]&&[-f"$PV"]||{echo'Missing solar.dat or pv.dat.'>&2;exit1;}command-vgnuplot>/dev/null2>&1||{echo'Gnuplot is required.'>&2;exit1;}
gnuplot<<EOF_GPset terminal pngcairo size 1200,900 enhanced font "sans,16"set output "$OUT"set xdata timeset timefmt "%Y-%m-%dT%H:%M:%S"set format x "%H:%M"set gridset multiplot layout 2,1 title "Solar radiation and estimated PV output"set ylabel "Solar radiation (W/m^2)"set xlabel ""set yrange [0:$SOLAR_MAX]set key offplot "$SOLAR" using 1:2 with lines linewidth 2 linecolor rgb "#E69F00"set ylabel "PV output (kW/kWp)"set xlabel "Time (JST)"set yrange [0:$PV_MAX]plot "$PV" using 1:2 with lines linewidth 2 linecolor rgb "#0072B2"unset multiplotEOF_GPecho"Created: $OUT"
daily_energy.sh Shell
What does it do? Feeds solar.dat and pv.dat to dailyenergy.java and saves the calculated daily totals to daily_energy.txt while also showing them on screen.
#!/bin/shset-eu
["$#"-eq3]||{echo"Usage: $0 YYYY MM DD">&2;exit1;}DAY="${1}${2}${3}";DIR="data/timeseries/$DAY";SOLAR="$DIR/solar.dat";PV="$DIR/pv.dat";OUT="$DIR/daily_energy.txt"[-f"$SOLAR"]&&[-f"$PV"]||{echo'Missing solar.dat or pv.dat.'>&2;exit1;}SRC=analysis.msm1km/dailyenergy.java;CLS=analysis.msm1km/dailyenergy.class
if[!-f"$SRC"];thenecho"Refreshing analysis programs..."wget-q-Oanalysis_msm1km.tar.gzhttps://amaterass.science/science-lab/analysis_msm1km.tar.gz
tarxzfanalysis_msm1km.tar.gz
fi[-f"$SRC"]||{echo"Could not prepare $SRC">&2;exit1;}if[!-f"$CLS"]||["$SRC"-nt"$CLS"];thenjavacanalysis.msm1km/*.java;fi
java-cpanalysis.msm1kmdailyenergy"$SOLAR""$PV"|tee"$OUT"echo"Saved: $OUT"
dailyenergy.java Java
What does it do? Integrates adjacent time-series samples with the trapezoidal rule, converting W/m² to kWh/m² and kW/kWp to kWh/kWp. This is the step where the time series becomes an integrated physical quantity.
importjava.io.*;importjava.nio.file.*;importjava.time.*;importjava.time.format.*;importjava.util.*;publicclassdailyenergy{staticclassSample{longt;doublev;Sample(longt,doublev){this.t=t;this.v=v;}}staticList<Sample>read(Pathp)throwsException{List<Sample>a=newArrayList<>();ZoneIdjst=ZoneId.of("Asia/Tokyo");for(Stringline:Files.readAllLines(p)){line=line.trim();if(line.isEmpty()||line.startsWith("#"))continue;String[]x=line.split("\\s+");if(x.length<2)continue;LocalDateTimeldt=LocalDateTime.parse(x[0],DateTimeFormatter.ofPattern("yyyy-MM-dd'T'HH:mm:ss"));doublev=Double.parseDouble(x[1]);if(!Double.isFinite(v))continue;a.add(newSample(ldt.atZone(jst).toEpochSecond(),v));}a.sort(Comparator.comparingLong(s->s.t));returna;}staticdoubleintegrate(List<Sample>a,doublescale){doublee=0.0;intused=0;for(inti=1;i<a.size();i++){Samplep=a.get(i-1),q=a.get(i);doubledt=(q.t-p.t)/3600.0;if(dt<=0.0||dt>0.25)continue;e+=(p.v+q.v)*0.5*dt*scale;used++;}if(used==0)thrownewIllegalArgumentException("No consecutive samples could be integrated");returne;}publicstaticvoidmain(String[]args)throwsException{if(args.length!=2){System.err.println("Usage: dailyenergy solar.dat pv.dat");System.exit(1);}List<Sample>solar=read(Paths.get(args[0])),pv=read(Paths.get(args[1]));if(solar.size()<2||pv.size()<2)thrownewIOException("Not enough time-series samples");doublesolarKWh=integrate(solar,1.0/1000.0);doublepvKWh=integrate(pv,1.0);System.out.printf(Locale.ROOT,"Solar energy : %.3f kWh/m^2%n",solarKWh);System.out.printf(Locale.ROOT,"PV energy : %.3f kWh/kWp%n",pvKWh);System.out.printf("Samples : solar=%d pv=%d%n",solar.size(),pv.size());}}
BONUS MISSION: Explore further
This Science Lab focuses on msm.1km solar-radiation and PV-output data. The same ideas—averaging, cropping, differences, time series, and integration—can be applied to other AMATERASS products and regions.
Download all helper files: A Science Lab helper-files ZIP is also available. Tmap itself is not included. Normally, follow each step and use the shown wget command to place the required files directly in ~/amaterass_lab.
Notes and disclaimer
Please review the following notes before using this Science Lab.
About this material
This material is intended for education and research. Care has been taken to ensure accuracy, but operation in every environment, completeness of the content, and continued future availability are not guaranteed.
About analysis results
Images and numerical results produced here are for learning and analysis. Do not use them as the sole basis for decisions involving life, property, disaster response, equipment operation, or safety management.
Data and network access
AMATERASS data and external distribution servers may be temporarily unavailable because of maintenance, network problems, or specification changes. Check the AMATERASS data-use and download information for applicable terms.
Software and third-party data
Tmap is released under the MIT License. Third-party data included with Tmap are subject to separate licenses; see the license documents in the distribution for details.
To the extent permitted by law, the author and related institutions are not liable for direct or indirect damages arising from use of this material, distributed scripts, data, or external services. The content and availability of external sites are also not guaranteed.